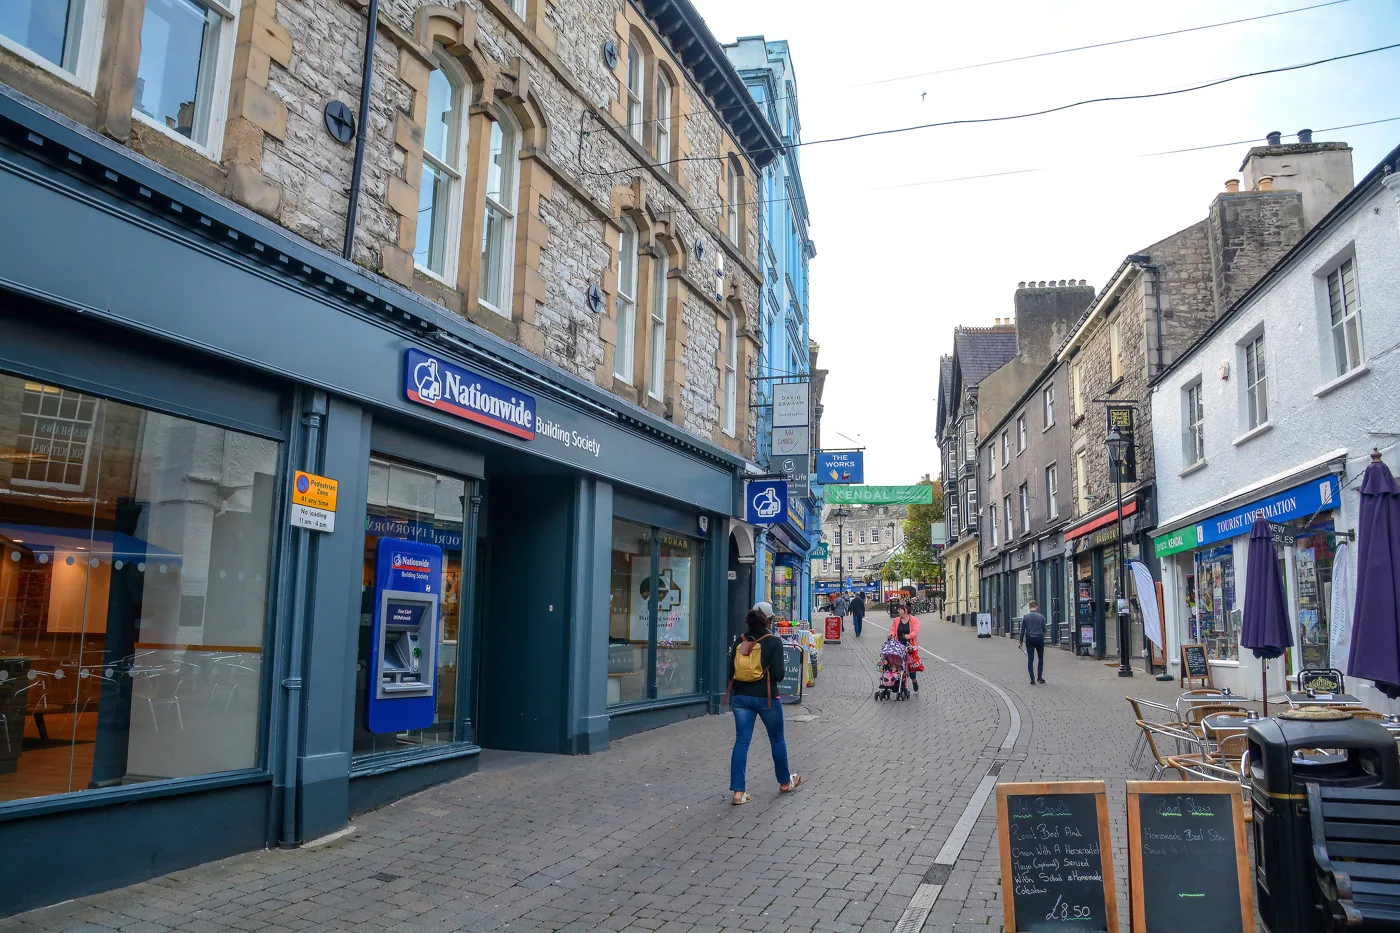

Kendal's five wards recorded 320 claimants in August, the joint highest of 2026. Nether ward rose 15 in a month, against a district figure flat on the year.
320 people across Kendal’s five council wards were claiming unemployment related benefits in August 2026. That is the joint highest monthly figure of the year so far, level with February, and it is up from 305 in July.
The Office for National Statistics published the August figures on 15 September. There is no published Kendal claimant count as such, so we have pulled the ward level numbers from nomis, because the headline that gets reported is for the whole of Westmorland and Furness, and that number is dominated by Barrow.
The Kendal wards in August
| Ward | August | July | Change |
|---|---|---|---|
| Kendal Strickland and Fell | 90 | 90 | no change |
| Kendal Highgate | 85 | 85 | no change |
| Kendal Nether | 75 | 60 | up 15 |
| Kendal South | 45 | 40 | up 5 |
| Kendal Castle | 25 | 30 | down 5 |
| Five wards | 320 | 305 | up 15 |
The whole of the month’s movement in Kendal is in one ward. Nether has not been above 65 in any other month of 2026, and it sat on 60 for five months running from April to July. Seventy-five is a clear break from that.
Fifteen people is a small number, and the figures are rounded to the nearest five, so read it as a move rather than a precise count. It is still the only ward in the town that moved by more than five this month.
Across all 33 wards in Westmorland and Furness, only two rose by 15, and both are in the south Lakes: Kendal Nether, and Windermere and Ambleside, which went from 70 to 85. No ward anywhere in the district rose by more. Bowness and Lyth went the other way, down from 30 to 20. In a district whose economy runs on a summer season, the end of August is when that shows up.
The district number, and a correction to ours
Westmorland and Furness as a whole recorded 2,415 claimants in August, which is 1.8% of residents aged 16 to 64. That is up 55 on July.
A correction. When we reported the July figures on 22 August we gave the district total as 2,410 and the rate as 1.8%. The ONS has since revised July down to 2,360 and 1.7%. The claimant count routinely revises the previous month, and we are noting it here rather than quietly changing the earlier article. The Kendal ward total for July is unchanged at 305, although two wards inside it were revised by five each.
That revision matters for how you read the month. On the figures as they now stand, the district rose 2.3% between July and August. The UK rose 2.3% over the same month and the north west rose 2.5%. August is the month school and college leavers appear in the count, and Westmorland and Furness moved exactly in line with the country.
Over the year, this is the only area here that did not rise
The more interesting comparison is August 2025 against August 2026.
| Area | Aug 2025 | Aug 2026 | Change |
|---|---|---|---|
| Westmorland and Furness | 2,425 | 2,415 | down 0.4% |
| Cumberland | 3,915 | 4,150 | up 6.0% |
| Lancaster | 2,570 | 2,675 | up 4.1% |
| North West | 195,875 | 201,555 | up 2.9% |
| United Kingdom | 1,663,580 | 1,698,450 | up 2.1% |
Every comparison we can reasonably draw went up over the year. This district did not. On the rate, Westmorland and Furness is at 1.8% against Cumberland’s 2.5%, Lancaster’s 2.9%, the UK’s 3.9% and the north west’s 4.2%.
The under-25 picture is the same only sharper. Claims by 18 to 24 year olds in Westmorland and Furness were 460 in August, down from 520 two years ago, a fall of 11.5%. Over the same two Augusts the UK’s rose 18.1% and Cumberland’s, the other half of the old Cumbria, rose 21.2%.
We said in August that this was worth watching rather than celebrating, because 460 is a thin base on a small and old population, and thirty or forty people moves the percentage a long way. Three data points across three years is now enough to say the direction is real, even if the size of it is not precise.
Why we do not quote the district rate as Kendal’s
The whole point of using ward data here is that the council area is not one place. In August, Old Barrow and Hindpool ward on its own recorded 455 claimants, more than all five Kendal wards put together. Barrow’s town wards account for a large share of a district total that also covers Penrith, Appleby and the south Lakes.
Around Kendal in August: Windermere and Ambleside 85, Sedbergh and Kirkby Lonsdale 60, Grange and Cartmel 55, Kent Estuary 40, Coniston and Hawkshead 30, Burton and Holme 25, Upper Kent 25, Bowness and Lyth 20, Levens and Crooklands 10.
What it means for you
- This is not the unemployment rate. The claimant count records people claiming benefits principally because they are unemployed. Since Universal Credit it also includes people who are working but on low earnings and still required to look for more. It is a narrower measure than unemployment and, in some ways, a wider one.
- The ward figures are rounded to the nearest five, and the ward series only begins in January 2026, so there is no year-on-year comparison at ward level yet.
- The local authority table is labelled “official statistics in development” by the ONS, and last month’s figure gets revised.
- The next release is 20 October 2026, covering September.
Sources: ONS claimant count, dataset NM_162_1, via nomis, published 15 September 2026. Our July report is at Kendal claimant count: 305, as young claims buck the UK.
More Kendal information: house prices, council tax bands and planning news.
Have your say