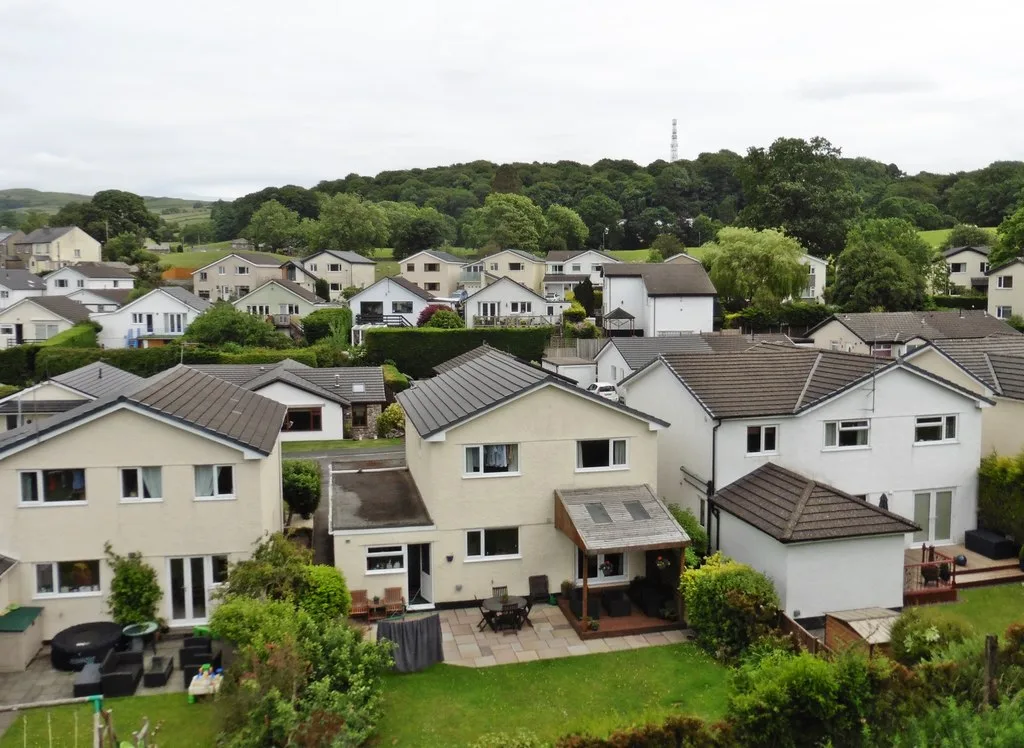

Only three of England's 295 districts rose faster in the year to June 2026. The Westmorland and Furness average is now £230,066, £248 below its record.
Average house prices across Westmorland and Furness rose 11.1% in the year to June 2026, to £230,066. Only three of England’s 295 local authority districts rose faster.
The figures come from the UK House Price Index, published by HM Land Registry on 19 August. We took them from the index’s full monthly file, which carries every English district on the same basis, so the ranking below is calculated rather than estimated.
England as a whole managed 1.8%. This council area rose six times faster.
The rise is real, but it is measured against a bad year
The 11.1% needs one piece of context, and it is the piece most coverage leaves out. The comparison month is June 2025, and June 2025 was the worst month this area has had in years.
The average price then was £207,080, down 5.0% on the year before. That was the bottom of a slump that ran from spring 2025 into the following winter. As recently as March 2026 the annual change was still negative, at -3.7%.
So the swing has been fast. Three months ago the index said prices here were falling. It now says they are rising faster than almost anywhere in England. Part of that is genuine recovery, and part of it is simply that last summer set a low bar.
The level is the steadier number to watch. At £230,066 the average is £248 below the area’s all-time high of £230,314, set in November 2024. Prices have recovered what they lost, and not much more.
What it means for you
- If you are selling, the market is stronger than it was a year ago, but the average has only just got back to where it was in late 2024. A 2024 valuation is a better guide than an 11% uplift on a 2025 one.
- If you are buying, the pressure is real. The first-time buyer average across the council area is £192,798, up 11.5% in a year. That is £19,842 more than a year earlier, on the type of purchase where the deposit is the binding constraint.
- If you are remortgaging, the rise may have moved you into a better loan-to-value band. It is worth rechecking.
- If you are watching the figure itself, note that it moves. The May 2026 average was first published at £227,987 and a 6.8% annual rise. In this month’s file it has been revised down to £226,980 and 6.3%. April was revised down by £2,045. First releases are estimates.
Which homes rose most
The rise is broad rather than driven by one type. Terraced homes led it.
| Property type | June 2026 average | Change on the year |
|---|---|---|
| Detached | £391,284 | +10.5% |
| Semi-detached | £249,512 | +11.6% |
| Terraced | £186,366 | +12.0% |
| Flat or maisonette | £133,604 | +7.9% |
| First-time buyer | £192,798 | +11.5% |
| Former owner-occupier | £274,015 | +10.8% |
Source: UK House Price Index, June 2026.
Flats are the outlier at 7.9%, and they are also the cheapest thing on the list by a distance. A flat here averages £133,604, barely a third of a detached house.
How the neighbours compare
Westmorland and Furness rose faster than any of its neighbours, by some way.
| Area | June 2026 average | Change on the year |
|---|---|---|
| Westmorland and Furness | £230,066 | +11.1% |
| North Yorkshire | £270,569 | +3.1% |
| Cumberland | £172,036 | +6.9% |
| Lancaster | £199,762 | +4.9% |
| North West region | £219,922 | +4.7% |
| England | £293,262 | +1.8% |
North Yorkshire is still dearer in absolute terms, at £270,569, but it rose 3.1%. Cumberland, the other half of the old Cumbria, sits £58,030 lower at £172,036.
The number is not a Kendal number
This is the caveat that matters most on a Kendal page, and it is a structural one.
Westmorland and Furness was created in April 2023 by merging South Lakeland, Eden and Barrow-in-Furness. The index averages all three. Barrow is an industrial shipbuilding town on the coast; Eden runs up to Penrith and Appleby; the south Lakes has Windermere in it. There is no single housing market here, and £230,066 is the average of at least three.
Two further points on how to read it:
- UK House Price Index figures are a mean average, not a median. A handful of large sales pull a mean upwards. The highest home sale recorded in the Kendal postcodes over the last twelve months was £4.5m, in Crook.
- The index is modelled, not a straight count of what sold. It adjusts for the mix of property types traded each month, which is why it can differ from a raw median of local sales.
For Kendal itself, the closer figure is the median completed sale, which was £249,000 across 440 sales in the twelve months to 30 June 2026. In the Lakes parish, covering Ambleside, Grasmere and Elterwater, it was £385,000. Those are on our Kendal house prices page, matched sale by sale to civil parish rather than reported by postcode district.
Where these figures come from
Every figure above is from the UK House Price Index for June 2026, published by HM Land Registry on 19 August 2026. We took them from the index’s full monthly file, so that all 295 English districts are compared on the same basis. The Westmorland and Furness area code is E06000064.
Sales volumes are not published for the two most recent months. This piece therefore quotes prices rather than transaction counts.
Update, 22 September 2026. The Land Registry has since revised June 2026 down. In the July 2026 file the month reads £228,066 and a rise of 10.1%, rather than the £230,066 and 11.1% published on 19 August and reported above, which moves the district from joint fourth to seventh of the 295 English districts. The index is revised each month as more completed sales are registered. We have left the original figures in place rather than rewriting them, and set out the revision in full in our report on the July 2026 figures.
More Kendal local information: house prices by parish, roadworks and travel, trains to London and planning news.
Have your say