

The average home in Westmorland and Furness reached £234,435 in September, a record. Prices are rising 4.6% a year, half June's pace of 9.4%.
The average home in Westmorland and Furness was worth £234,435 in September 2026. That is the highest figure the UK House Price Index has recorded for the area, on a back series that starts in January 1995.
Prices rose 1.6% on the month and 4.6% on the year. The record comes with a catch: the annual rise is now half what it was in June.
The figures are HM Land Registry’s, published on 18 November. We take them from the index’s full monthly file, which puts every English district on the same basis.
Overview
- Average price, September 2026: £234,435, a record for the district
- Up 1.6% on August (£230,671) and up 4.6% on September 2025 (£224,169)
- The previous high was £230,871 in July 2026
- 27 of England’s 295 districts rose faster over the year; 108 fell
A record, but the rise is slowing
In the summer this district had one of the fastest rising markets in England. That has cooled. The annual change, month by month, in the latest file:
| Month (2026) | Average price | Change on a year earlier |
|---|---|---|
| June | £226,478 | 9.4% |
| July | £230,871 | 7.9% |
| August | £230,671 | 4.9% |
| September | £234,435 | 4.6% |
Part of the slowdown is the comparison, not the market. Prices here climbed quickly in the autumn of 2025, so each month this year is measured against a higher starting point. The average itself has still risen in four of the last five months.
Our July figures have been revised
We reported in September that the average reached £230,449 in July, up 7.7%. In the September file, July now reads £230,871, up 7.9%. The index is revised every month as more sales are registered, and the newest months are the least settled. September’s figure will move too. Our July report carries a note.
What each type of home costs
By property type in September 2026:
- detached: £397,883, up 4.6% on the year
- semi-detached: £254,461, up 5.3%
- terraced: £190,347, up 4.9%
- flats and maisonettes: £135,484, up 1.3%
The first-time buyer average was £196,829, up 4.9%. As in the summer, semi-detached and terraced homes are rising fastest and flats slowest.
How the neighbours compare
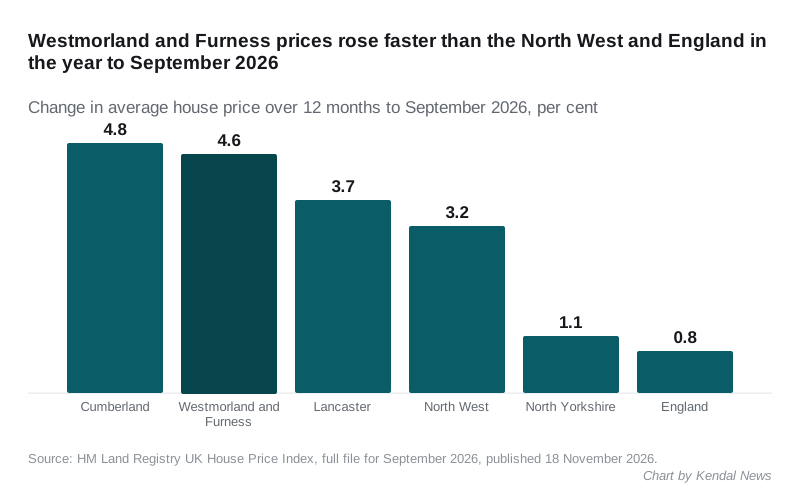
Over the year to September:
- Cumberland: £173,990, up 4.8%
- Lancaster: £203,432, up 3.7%
- North Yorkshire: £272,191, up 1.1%
- North West: £220,477, up 3.2%
- England: £292,998, up 0.8%
Cumberland, to the north, rose slightly faster over the year, from a much lower starting price. Of the North West’s 35 council areas, this district now has the tenth highest average price, between West Lancashire (£244,848) and Salford (£226,019).
Fewer homes are changing hands
Sales figures run two months behind prices and are the most heavily revised part of the index. On the provisional count:
- 218 sales in July 2026, against 305 in July 2025
- 3,393 sales in the twelve months to July 2026, against 3,803 the year before
Those counts usually rise as late registrations arrive. In September we reported 209 sales for May 2026; the latest file puts May at 236.
What it means for you
This is a district figure, not a Kendal one. Westmorland and Furness merged South Lakeland, Eden and Barrow-in-Furness in 2023, so the average mixes Kendal and the lakes with Barrow and the Eden valley.
- The index is a mean, not a median. A few expensive sales pull it up in a way they cannot pull a median.
- Kendal itself sells for more. On completed sales, the middle sale in Kendal parish over the year to 30 June 2026 was £249,000. The figures for each parish are on our Kendal house prices page.
- If you are buying a first home, the first-time buyer average rose by £9,202 in a year, from £187,627 in September 2025 to £196,829.
Sources: HM Land Registry UK House Price Index for Westmorland and Furness and the full UK HPI file for September 2026. Contains HM Land Registry data © Crown copyright and database right 2026, licensed under the Open Government Licence v3.0.
Have your say