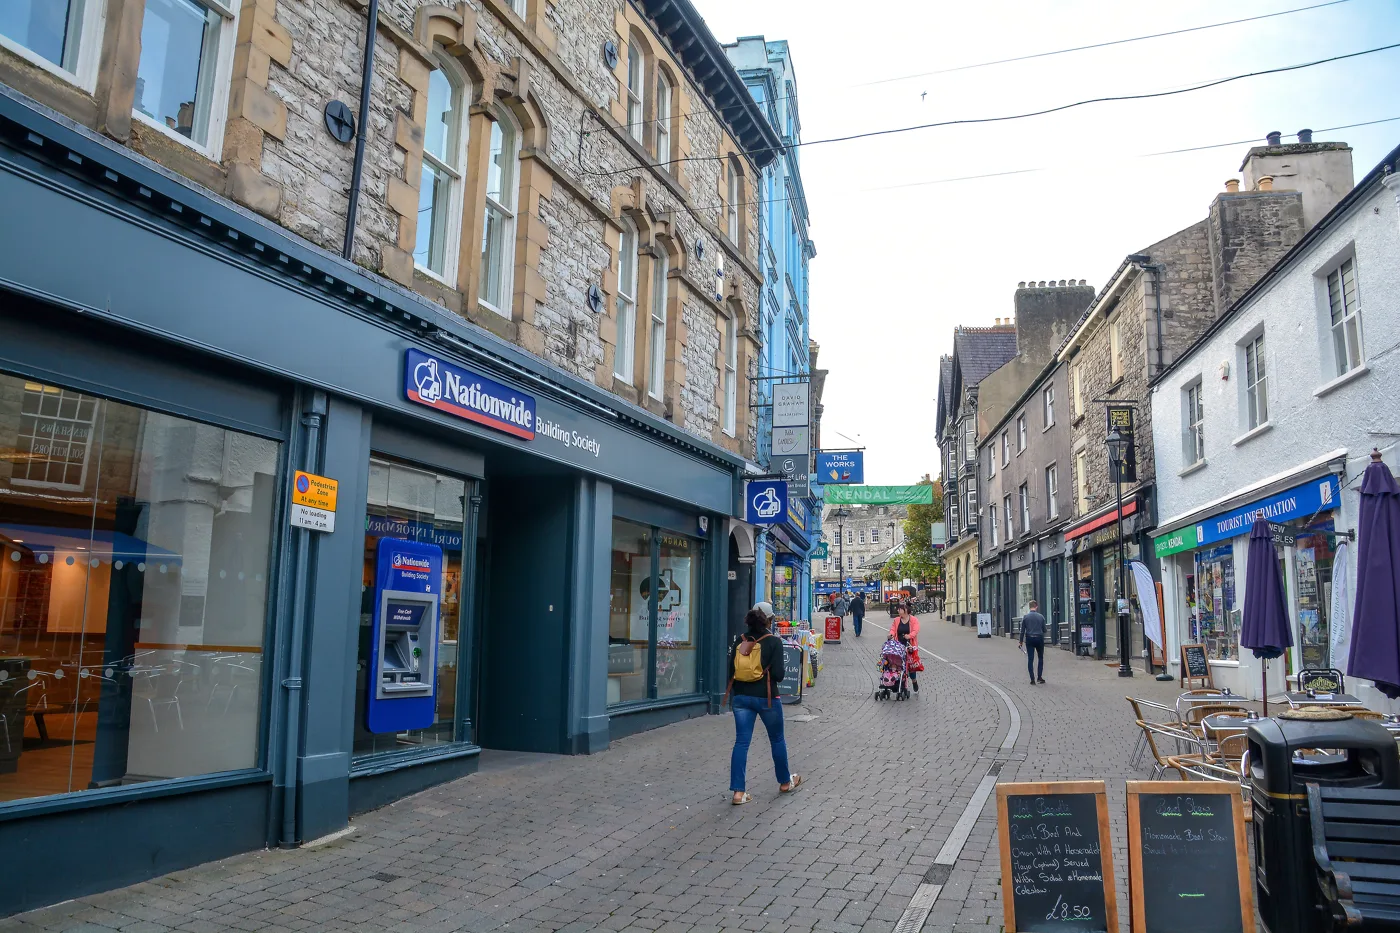

Kendal's five wards had 295 claimants in October, level with January as the year's lowest. Across Westmorland and Furness, claims by over-50s rose 45 in a month.
Overview
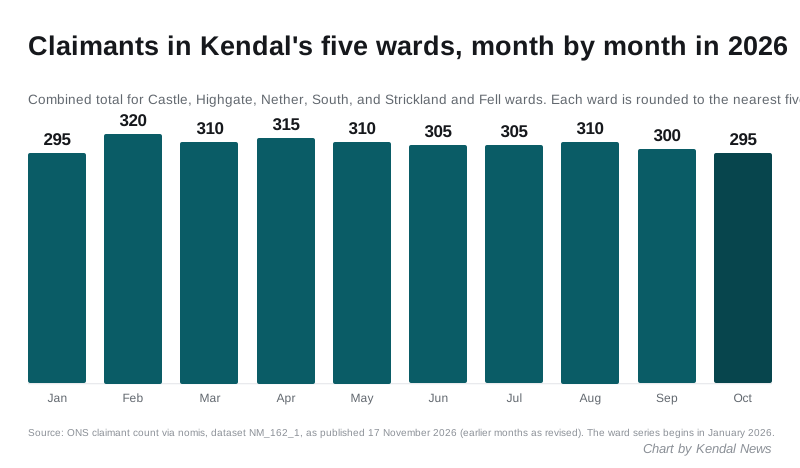
295 people in Kendal’s five council wards were claiming unemployment related benefits in October 2026. That is down from 300 in September and level with January as the lowest figure of the year. The district as a whole went the other way, up 40 to 2,415.
The Office for National Statistics published the October figures on 17 November. There is no official Kendal figure, so we add up the town’s five wards from nomis. The headline number for Westmorland and Furness is dominated by Barrow, so it says little about Kendal on its own.
The Kendal wards in October
| Ward | October | September | Change |
|---|---|---|---|
| Kendal Strickland and Fell | 85 | 95 | down 10 |
| Kendal Highgate | 80 | 80 | no change |
| Kendal Nether | 70 | 65 | up 5 |
| Kendal South | 35 | 35 | no change |
| Kendal Castle | 25 | 25 | no change |
| Five wards | 295 | 300 | down 5 |
Strickland and Fell, in the north of the town, accounts for the whole of the fall. Its 85 is its lowest since March. Nether went the other way: its 70 equals August as the ward’s highest month of 2026.
Every ward figure is rounded to the nearest five. A change of five is within that rounding, so read the month as steady rather than as a real fall.
The rise was in the villages and Penrith, not Kendal
The district total rose from 2,375 in September to 2,415 in October. That is 1.8% of residents aged 16 to 64.
Some of the rise came from the wards around Kendal. The nine other south Lakes wards went from 335 claimants to 360 between them. The biggest moves were:
- Windermere and Ambleside: up 10, to 85
- Grange and Cartmel: up 10, to 70, its highest month of 2026
- Sedbergh and Kirkby Lonsdale: up 5, to 60
- Kent Estuary: up 5, to 40
October is the first month after the summer season in the Lakes, so a rise in the tourist wards is not a surprise. The largest increase anywhere in the district was Penrith South, up 20 to 150, about 25 miles north of Kendal.
The rest of the south Lakes in October: Bowness and Lyth 25, Upper Kent 25, Burton and Holme 30, Coniston and Hawkshead 20, Levens and Crooklands 5.
Over-50s are the age group that moved
Claims by people aged 50 and over in Westmorland and Furness rose from 550 in September to 595 in October. That is the highest figure for the age group since March 2025, and up 12.3% on October 2025, when it stood at 530. Across the UK the over-50s count rose 6.3% over the same year.
Younger claimants did the opposite. Claims by 16 to 24 year olds in the district were 450 in October, down from 460 a year earlier. Across the UK they rose 9.3%, to 348,515. Two years ago the district figure was 540, so it has fallen by a sixth since October 2024, while the UK’s has risen 18.1%.
Still flat on the year when its neighbours are not
| Area | Oct 2025 | Oct 2026 | Change | Rate |
|---|---|---|---|---|
| Westmorland and Furness | 2,420 | 2,415 | down 0.2% | 1.8% |
| Cumberland | 3,965 | 4,245 | up 7.1% | 2.5% |
| Lancaster | 2,550 | 2,730 | up 7.1% | 3.0% |
| North West | 193,935 | 202,795 | up 4.6% | 4.2% |
| United Kingdom | 1,650,220 | 1,707,320 | up 3.5% | 3.9% |
The rate is the share of residents aged 16 to 64 who are claiming. Westmorland and Furness is lower than every comparison in the table, and it is the only one that did not rise over the year. Source: ONS claimant count via nomis.
A correction to our August figures
When we reported the August figures on 19 September, we gave the Kendal ward total as 320 and the district total as 2,415. The ONS has since revised them. August now stands at 310 for Kendal’s five wards and 2,355 for the district. That means August was not the joint high of the year we reported. We have added a note to that article rather than changing it quietly.
What it means for you
- This is not the unemployment rate. The claimant count covers people claiming benefits mainly because they are out of work. Under Universal Credit it also includes some people in low-paid work who must look for more.
- The latest month is usually revised a month later, as August was. The local authority figures are labelled “official statistics in development” by the ONS.
- The ward series only starts in January 2026, so there is no year-on-year comparison for Kendal itself yet.
- If you have lost work, Kendal Jobcentre is the place to start a claim or get help looking.
Source: ONS claimant count, dataset NM_162_1, via nomis, published 17 November 2026.
Have your say